In this article, Jakob Wolfram talks about their recent publication “Graphing Ecotoxicology: The MAGIC graph for Linking Environmental Data on Chemicals”. This work detailed how a novel database structure was used to manage, aggregate, and harmonize different environmental databases in order to address large-scale environmental issues.
Assessing the impact of chemicals and addressing subsequent issues are central goals in ecotoxicology. In recent years, availability and abundance of environmental data has increased drastically, offering great opportunities to tackle ecotoxicological issues on larger scales. However, with data size, complexity and non-uniformity steadily increasing, data management solutions become necessary that are flexible, scalable, and extendable.
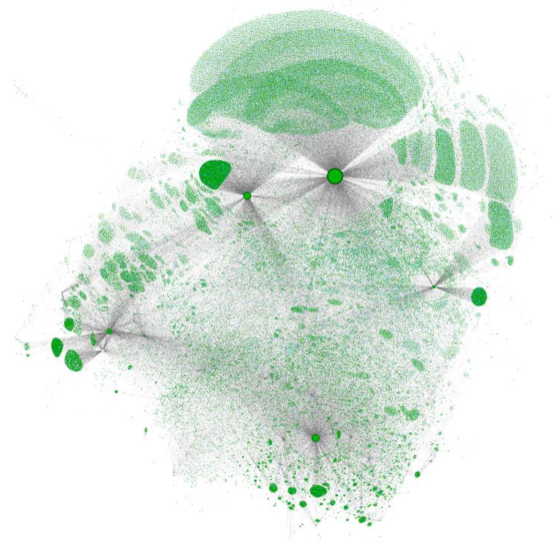
In our study, we constructed a graph-database (rule-based labelled graph), called the “MAGIC-graph”. The goal was to harmonize numerous ecotoxicological databases, such as the ECOTOX-db, the Water-Quality-Portal, USGS pesticide use estimates, and others, creating a uniform framework to work with all these important data comprehensively at once. In addition, we created a synonym network with the help of the U.S. EPA Chemical Dashboard. This enables our graph to easily identify chemicals even when they are named completely different (e.g., CAS, IUPAC name, formulation name) or described in differing structural detail (e.g. stereoisomers). This resulted in a database that closely resembles a network, rather than traditional lists (see Figure 1), which at the same time shows better computational performance.
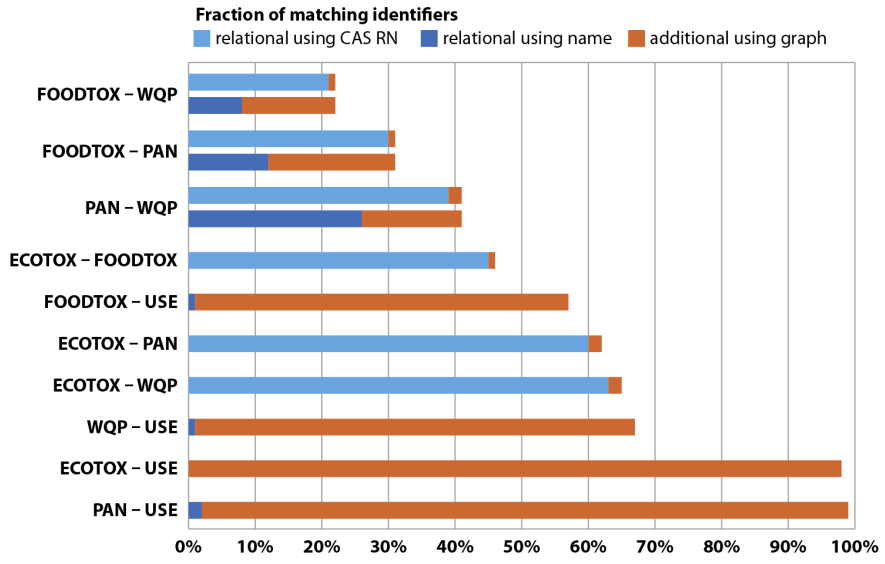
When we compared our approach to traditional (i.e., relational) database systems, we saw substantially higher rates of successfully linking chemicals (see Figure 2) with relevant information. In extreme cases, our approach managed to link up to 98% of the data, where traditional approaches failed. This underscored the importance of using a graph when trying to engage with those large-scale issues, which require comprehensive data that is often provided by multiple sources.
Since the original publication, the MAGIC-graph has grown immensely, in such a way that we cannot really visualize it. What started out as a chemical graph has now become a graph that is featuring, chemical, physical, spatio-temporal, ecotoxicological, bibliographical, and (soon) biological data. As a result, there are currently roughly 18 million so-called Nodes that have more than 83 million relationships to other entities in the graph. With the graph’s size and quality, new projects are currently being established that evolve around machine and deep learning, interfacing between established ecotoxicological research and novel data analytical tools. Finally, in the near future, new data is currently being processed and will be introduced in the graph, further increasing its size by approximately an order of magnitude.
The paper was published by Sascha Bub, Jakob Wolfram, Sebastian Stehle, Lara Luisa Petschick, and Ralf Schulz in Data. The publication is open-access and can be found here. Figures are reprinted with permission from MDPI.