In this post, Lara Petschick talks about the recent publication “Modeling Regulatory Threshold Levels for Pesticides in Surface Waters from Effect Databases”, which explains how existing ecotoxicological effect databases can be used to generate high-quality effect thresholds for large-scale environmental risk assessments.
Thresholds are needed to enable large-scale evaluations of measured environmental concentrations (MEC) of potentially harmful chemicals in freshwater systems. However, the derivation of regulatory threshold levels from regulatory documents is very cumbersome and becomes unfeasible for larger numbers of chemicals, such as pesticides.
To automate the process of threshold retrieval from these documents, we developed a SQL-based model that estimates acute freshwater regulatory threshold level equivalents (RTLe) from two large, publicly available effect databases (https://cfpub.epa.gov/ecotox/; https://ecotox.ipmcenters.org).
Conceptually, the model is based on the principles of manual RTL compilation: it checks the validity of the available effect studies and calculates thresholds based on the valid studies. Validity is checked by applying the official validity criteria used by expert consortia of the U.S. EPA for the selection of open literature studies and OCSPP standard test guidelines. Only relevant and reliable endpoints from the available effect studies (e.g., lab studies, that were run with a proper control, including chemical analysis of the test substance) were used, studies of lower quality or studies that were not relevant for RTL computations (e.g., conducted with multiple species) were discarded. Based on the most sensitive, remaining effect endpoint per substance, RTLe were calculated by applying the respective level of concern as safety factor (i.e., 0.5 for animals, 1 for aquatic plants).
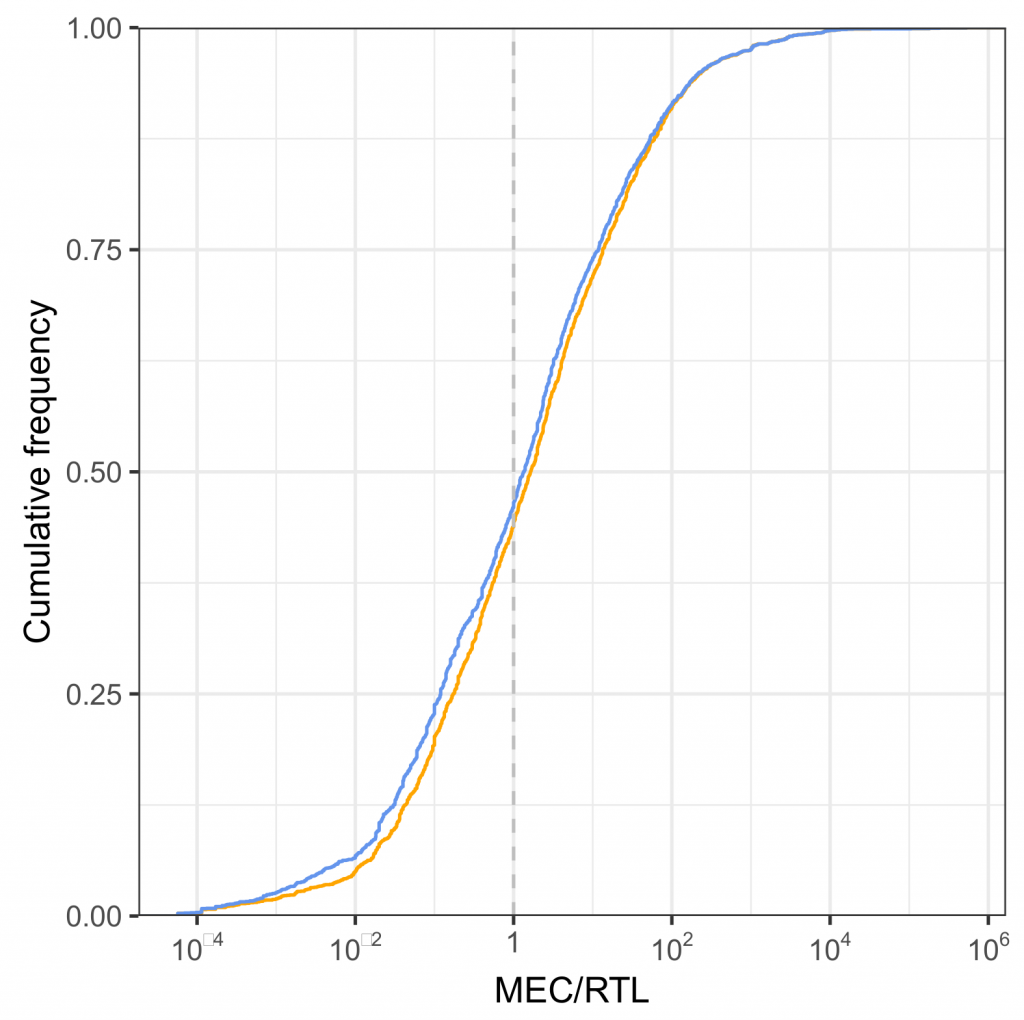
The model was calibrated for a set of 94 pesticides and validated against an independent sample of 49 additional pesticides. Further, we tested the performance of the modeled RTLe in comparison to manually compiled RTL in a case-study by evaluating exceedance rates of MEC (N=3001, see this blogpost) for a subset of 27 pesticides. In this case study, no significant difference (based on bootstrapped 95% CI) between the proportion of exceedance rates for RTLe and RTL was observed, highlighting the usability of RTLe for real-world scientific risk evaluations.
Updated lists of RTLe can be obtained from here. Further, RTLe are retrievable from the Magic Graph, a network-database for environmental data which you can read up on in this blogpost.
The paper was authored by Lara Luisa Petschick, Sascha Bub, Jakob Wolfram, Sebastian Stehle, and Ralf Schulz in Data. The publication is open-access and a more detailed description of the methods and applied criteria can be found here. The graphic is reprinted with permission from MDPI.